ML Experiments at Sift Science, Pt. 3: Building the Right Tools
In the first two posts of this three-part series we discussed how we ensure correctness when conducting and analyzing machine learning experiments at Sift. Determining how to construct experiments and evaluate their results correctly is great, but it is only useful if you ensure all of the experiments you run and evaluate use these correct techniques. If running an experiment correctly requires re-inventing all of the logic put in place to account for issues such as those discussed in the previous posts, then odds are that your team will not always run correct experiments.
Our solution to this problem is to provide tools that bake in correctness and make it easy for all experiments to be run and analyzed correctly. We have found that doing this has allowed our entire engineering organization to be more productive, as:
- Less time is wasted running and analyzing experiments with invalid results
- Engineers not on our machine learning team can easily and safely run experiments (e.g. an infrastructure engineer can easily experiment with improvements that speed up training or allow us to use more data)
The tools we have built allow us to:
- Easily run correct experiments
- Quickly perform high-level analysis of an experiment’s results
- Dig deeper into specific aspects of an experiment
Each of these is described in more detail below.
Tools that make it easy to run correct experiments
We have spent a great deal of time creating an offline training pipeline that bakes in all of the lessons we have learned around conducting experiments correctly. Today, using this pipeline is the only accepted way of producing valid experiment results at Sift.
Our pipeline consists of 4 primary phases:
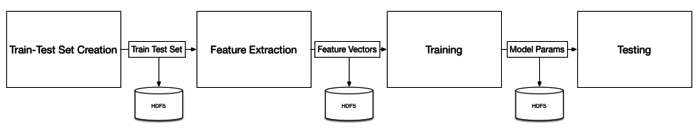
Each of these phases writes out intermediate results to HDFS, which allows us to easily reuse them to save time in subsequent experiments. This allows, e.g., the reuse of previously extracted feature vectors in a new experiment that only modifies the training stage. To make running experiments as easy as possible, we additionally have scripts in place that automatically setup the proper dependencies and orchestrate all jobs in the pipeline.
High level analysis tools
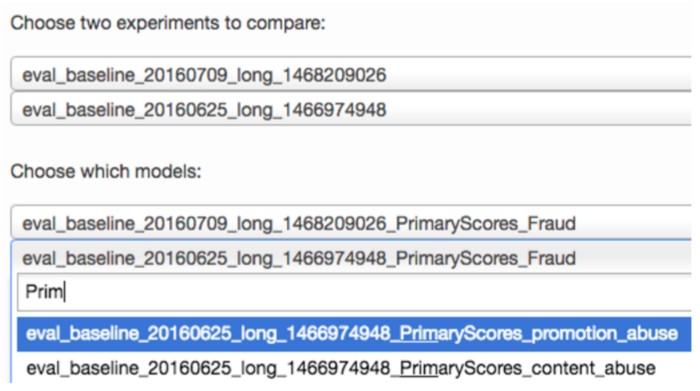
The primary tool we use to quickly analyze the results of an experiment is our Experiment Eval tool (as alluded to in the previous post). We begin an analysis using this tool by selecting two experiments and an abuse type (e.g. payment abuse):
From here we can quickly see all customers affected by the selected experiment sorted according to the significance of the change in their ROC AUC:
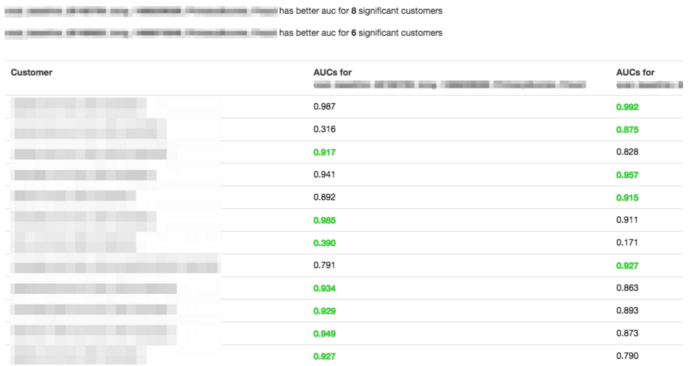
This allows us to quickly filter out the thousands of customers who are not significantly affected by the experiment under analysis. Given this, we can then dig into the (usually) small handful of customers who actually are affected. The Experiment Eval page also makes this easy to do by allowing us to surface the ROC, PR, and score distribution plots for a specific customer:
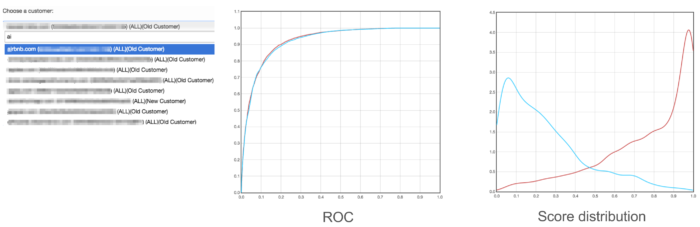
This mode also gives us various summary statistics, such as weighted mean error, the best F1 score, ROC AUC, etc. Together, these stats and plots are usually sufficient for understanding the nature of a change to a customer’s accuracy.
Tools for fine-grained analysis
For more complicated analysis, we have found it necessary to support some tools that allow us to drill more deeply into an experiment. For this use case, we’ve found Jupyter notebooks to be a perfect fit. These notebooks operate on side-outputs from our offline experimentation pipeline, and allow us to dig into the particulars of a given experiment by, e.g., restricting our analysis to only those samples that include a newly introduced feature.
One example where these notebooks have been useful was when we experimented with features derived from the MX record associated with the domain of a user’s email address. When we first analyzed this experiment using our Experiment Eval tool, we did not observe any significant difference in accuracy due to this change. But our intuition told us it should be adding value, so we dug deeper using Jupyter to find some users who would be affected by these new features, and sure enough, were able to find an improvement:
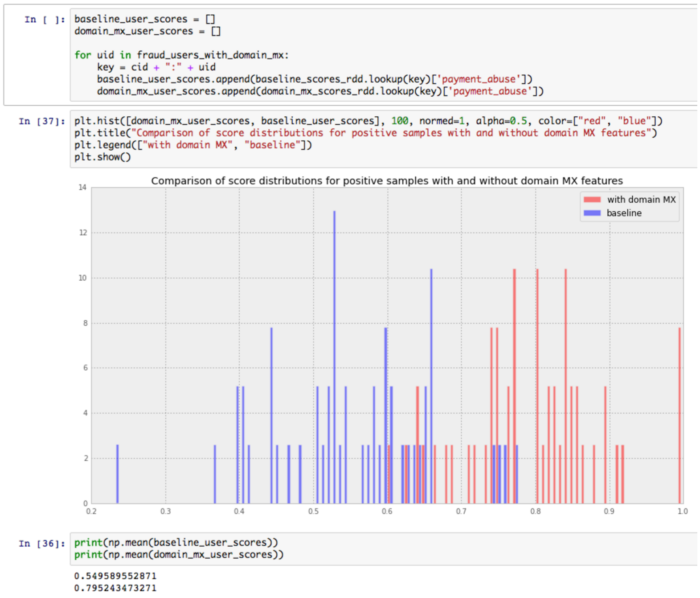
Our Experiment Eval tool described above did not pick up on this change because it only affected a small number of users; however, the small number of users it did affect were causing problems for one of our customers, and adding these features ended up helping them quite a bit.
Key takeaways
In summary, investing in tooling that makes it easy to conduct and analyze machine learning experiments correctly can go a long way towards improving the productivity and effectiveness of an engineering team working on an ML system. For us, a mixture of tools for fast, high-level analysis and more flexible, fine-grained analysis has worked best.
This is the final post in our series on machine learning experiments at Sift Science, but we are always learning more in this evolving area and plan on continuing to share our most useful lessons. Stay tuned.
Can’t get enough machine learning? Come fight fraud with us!